History deserves better than a bullet list.
Build timelines that do your stories justice.
Every event gets the detail it deserves. Year, specific date, description, notes, color, and tags. BCE dates? Of course. Julius Caesar was born in 100 BCE, and Timeline-O-Tron handles that without blinking.
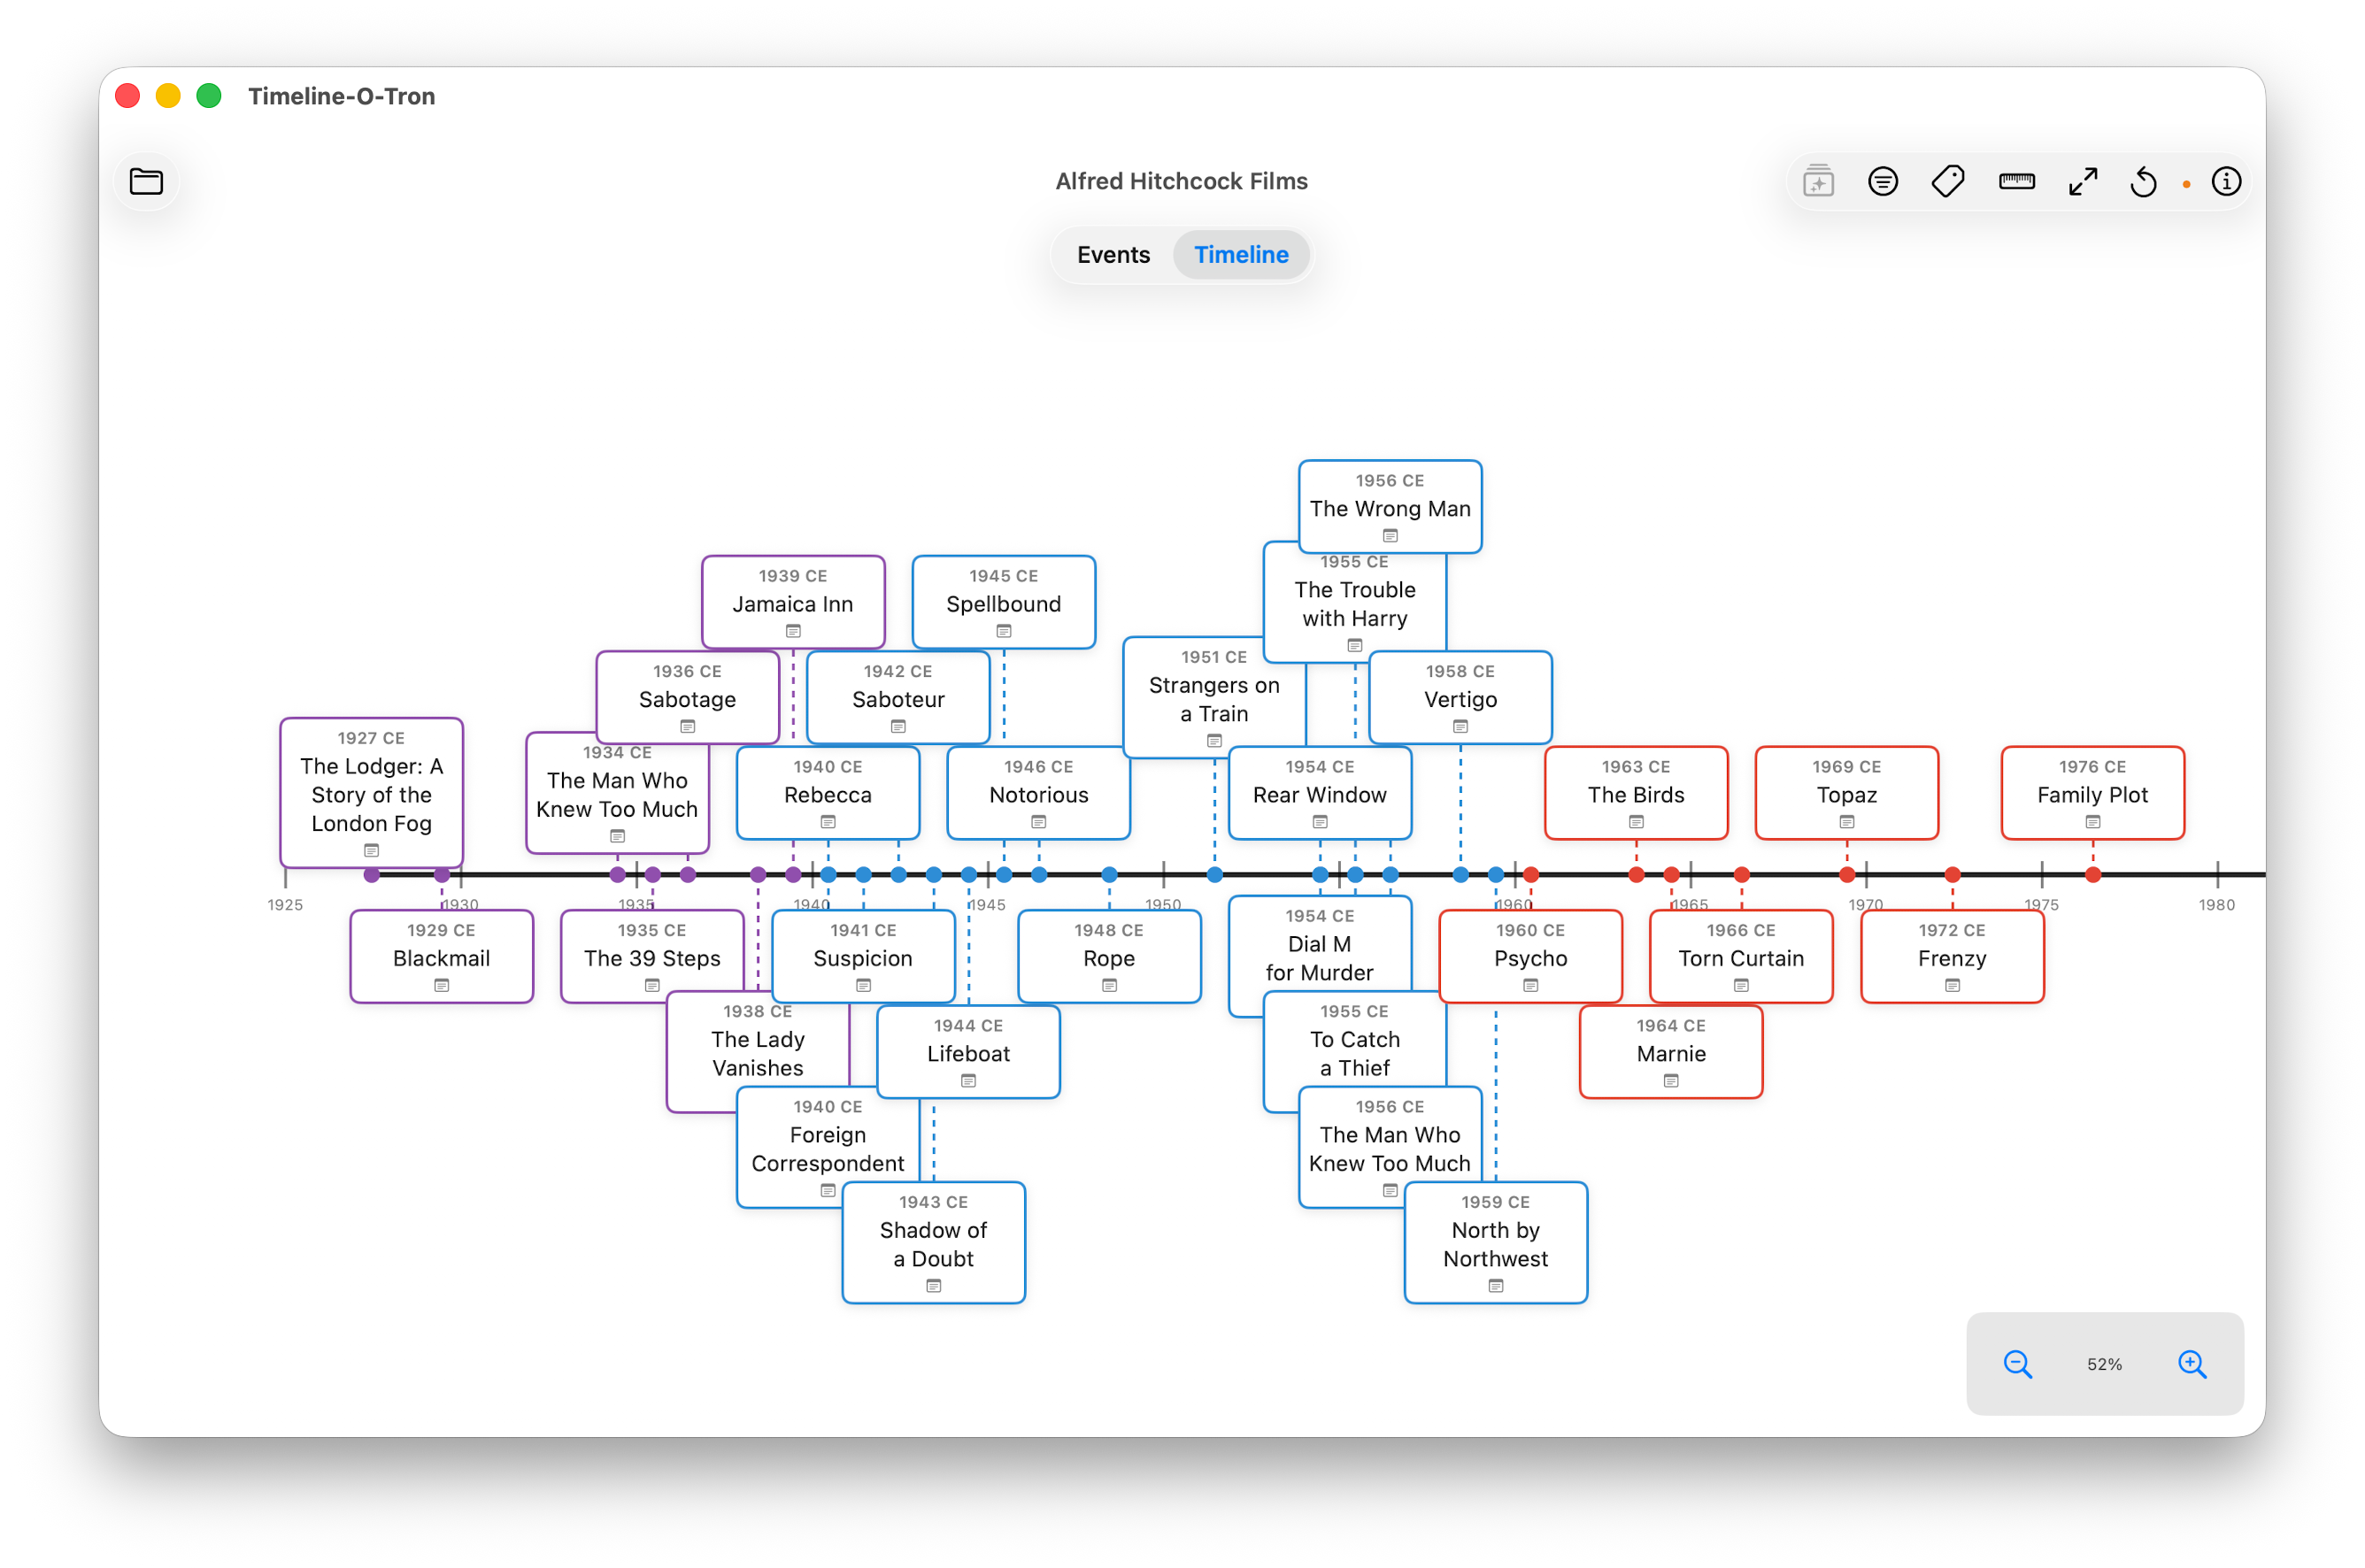
Your timeline draws itself on a scrollable, zoomable canvas. Zoom from 0.1× to 200× and watch month markers appear, then days. Events stack intelligently above and below the axis so nothing overlaps.
Ten colors. Unlimited tags. Filter by either, search by text. Color-code the Mercury program in red, Gemini in orange, Apollo in blue — then toggle any of them on or off to focus on what matters.
Tap two events and instantly see the time between them — down to the day. How long between Apollo 1 and Apollo 11? Six hundred and thirty days. Add notes to any event or to the timeline itself to capture context, sources, or color-coding schemes.
Type “History of jazz” and let AI do the research. You handle the curation. Or paste an entire article and watch it transform into a structured timeline. Works with OpenAI and Anthropic.
Export to CSV and impress your spreadsheet-loving colleagues. Export to HTML and impress everyone else. The HTML export generates a fully interactive, standalone website — no server required, works offline.
Native on Mac. Native on iPhone and iPad. Share your timelines across devices through iCloud. Research on your Mac, present from your iPad, check a date on your phone.
Full macOS menu bar. File, Edit, View, Timeline, AI — every action has its place. ⌘N to add, ⌘D to duplicate, ⌘0 to fit the timeline, ⌘⇧G to generate with AI.
Three richly detailed timelines ship with the app. Track every Apollo crew member from Mercury-Redstone 3 to Apollo 17. Follow the Beatles from Please Please Me to Let It Be. Screen all 32 Hitchcock films in order.
From the Great Pyramid to the Moon landing. From a first album to a final film. Whatever you're tracking, it deserves to be beautiful.
Download on the App Store